Create a multilinestring sf object representing cross in the middle of each grid cell
Source: R/Spat_GridCross.R
GridCross.RdCreate a multilinestring (cross in the middle of the grid) sf object from
each grid cell
Value
An sf object with multilinestring geometries representing crosses
in the middle of each input grid cell. The returned object has the same CRS
(Coordinate Reference System) as the input DT
Note
The function requires the sf, dplyr, purrr, tibble, and tidyr
packages to be installed and loaded.
See also
GridDiagOff for creating diagonal lines in grid cells.
Examples
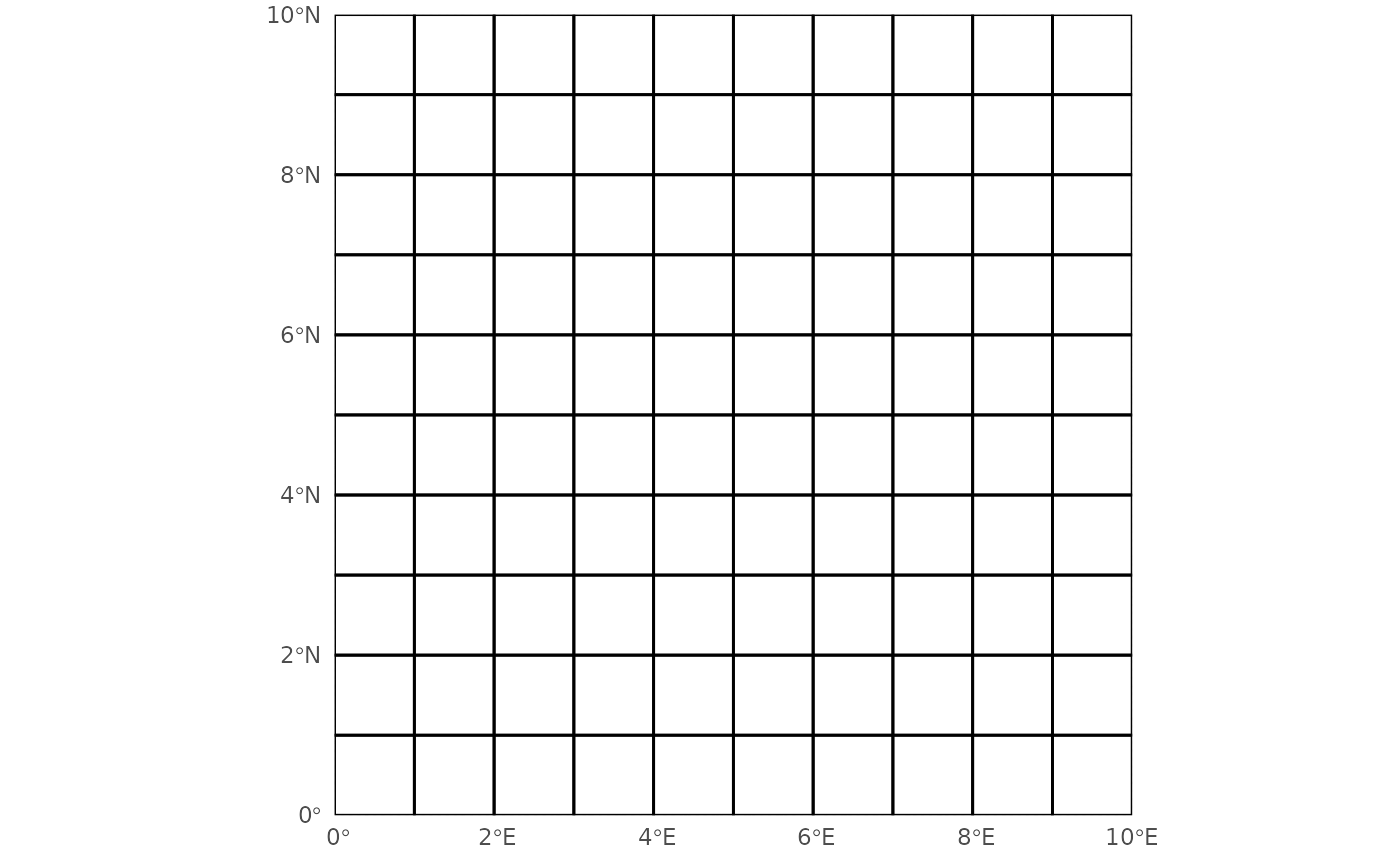
IASDT.R::LoadPackages(List = c("dplyr", "sf", "raster", "ggplot2"))
Grid <- raster::raster(
nrows = 10, ncols = 10, xmn = 0, xmx = 10,
ymn = 0, ymx = 10, crs = 4326) %>%
setNames("Grid") %>%
raster::setValues(1) %>%
raster::rasterToPolygons() %>%
sf::st_as_sf()
ggplot2::ggplot() +
ggplot2::geom_sf(Grid, mapping = ggplot2::aes(), color = "black",
linewidth = 0.5, fill = "transparent") +
ggplot2::scale_x_continuous(expand = c(0, 0, 0, 0), limits = c(0, 10)) +
ggplot2::scale_y_continuous(expand = c(0, 0, 0, 0), limits = c(0, 10)) +
ggplot2::theme_minimal()
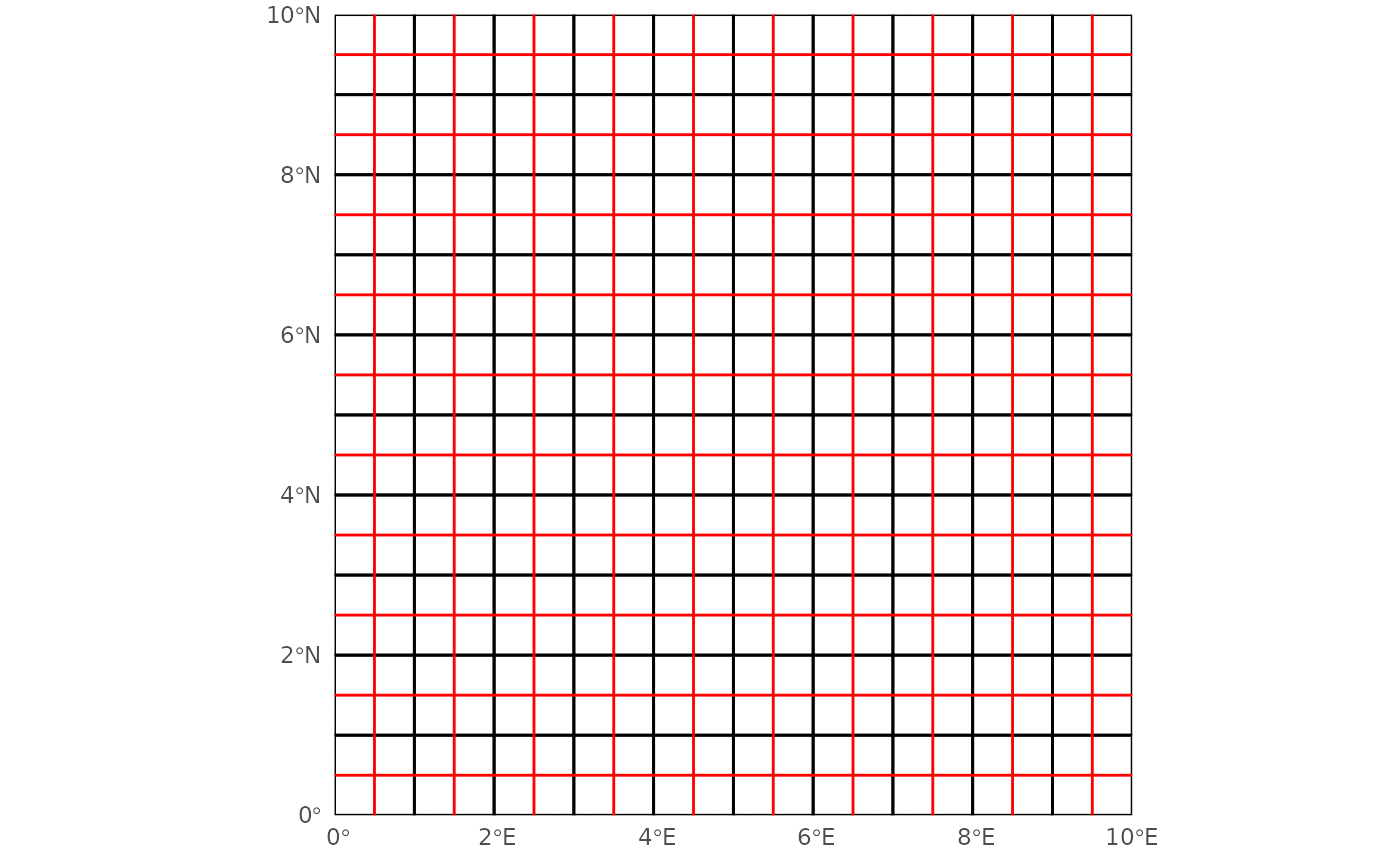
 Grid_X <- GridCross(Grid)
ggplot2::ggplot() +
ggplot2::geom_sf(Grid, mapping = ggplot2::aes(), color = "black",
linewidth = 0.5, fill = "transparent") +
ggplot2::geom_sf(Grid_X, mapping = ggplot2::aes(), color = "red",
linewidth = 0.5, inherit.aes = TRUE) +
ggplot2::scale_x_continuous(expand = c(0, 0, 0, 0), limits = c(0, 10)) +
ggplot2::scale_y_continuous(expand = c(0, 0, 0, 0), limits = c(0, 10)) +
ggplot2::theme_minimal()
Grid_X <- GridCross(Grid)
ggplot2::ggplot() +
ggplot2::geom_sf(Grid, mapping = ggplot2::aes(), color = "black",
linewidth = 0.5, fill = "transparent") +
ggplot2::geom_sf(Grid_X, mapping = ggplot2::aes(), color = "red",
linewidth = 0.5, inherit.aes = TRUE) +
ggplot2::scale_x_continuous(expand = c(0, 0, 0, 0), limits = c(0, 10)) +
ggplot2::scale_y_continuous(expand = c(0, 0, 0, 0), limits = c(0, 10)) +
ggplot2::theme_minimal()