Create a multilinestring sf object for the diagonal and off-diagonal lines for each grid cell
Source: R/Spat_GridDiagOff.R
GridDiagOff.RdThis function takes an sf object representing a grid and creates a new sf
object where each grid cell is represented by a multilinestring geometry
consisting of its diagonal and off-diagonal lines.
Value
An sf object where each row corresponds to a grid cell from the
input, represented by a multilinestring geometry of its diagonal and
off-diagonal lines. The returned object retains the coordinate reference
system (CRS) of the input.
Note
The function requires the sf, dplyr, purrr, tibble, and tidyr
packages to be installed and loaded.
Examples
IASDT.R::LoadPackages(List = c("dplyr", "sf", "raster", "ggplot2"))
Grid <- raster::raster(nrows = 10, ncols = 10, xmn = 0, xmx = 10,
ymn = 0, ymx = 10, crs = 4326) %>%
setNames("Grid") %>%
raster::setValues(1) %>%
raster::rasterToPolygons() %>%
sf::st_as_sf()
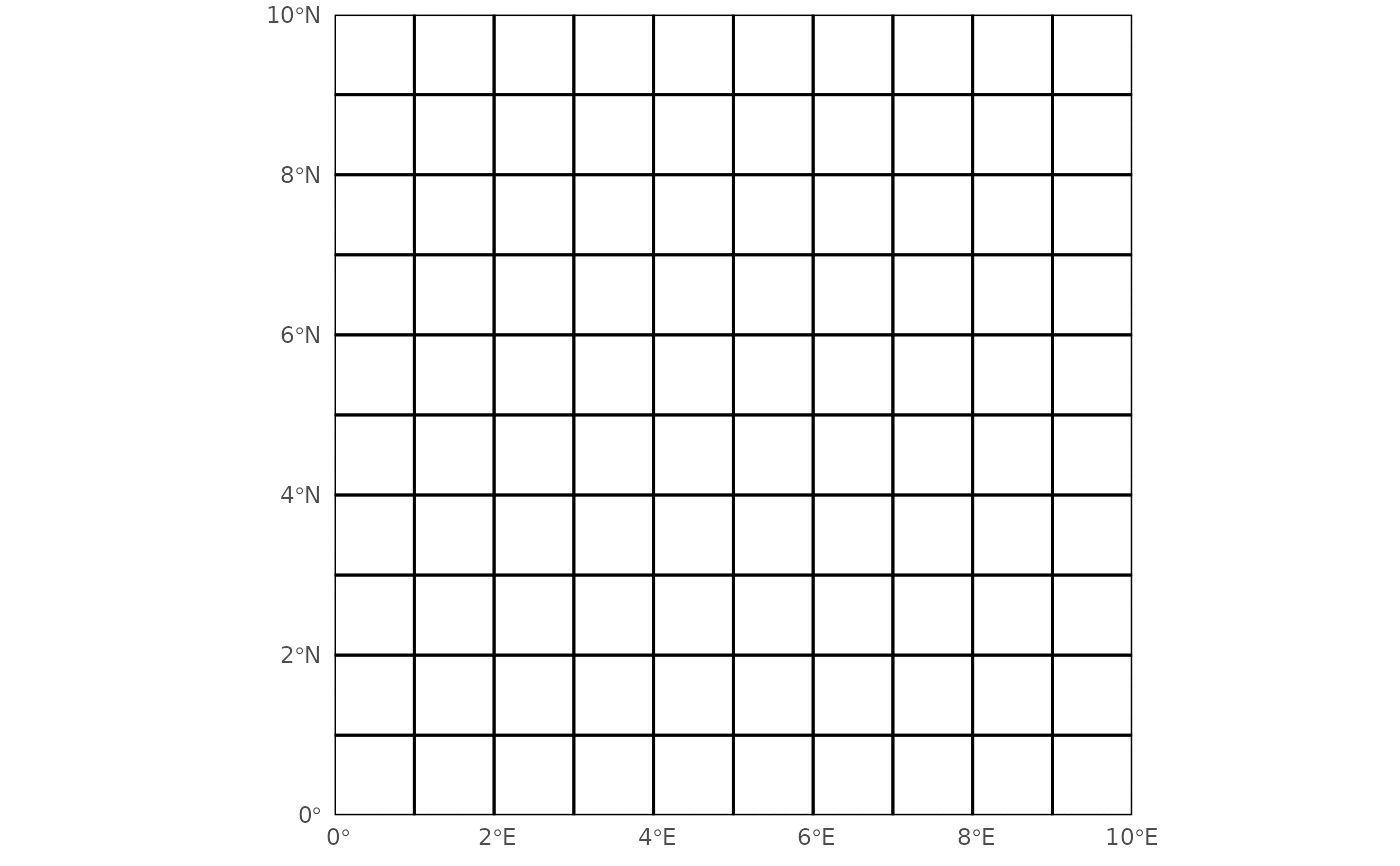
ggplot2::ggplot() +
ggplot2::geom_sf(Grid, mapping = ggplot2::aes(), color = "black",
linewidth = 0.5, fill = "transparent") +
ggplot2::scale_x_continuous(expand = c(0, 0, 0, 0), limits = c(0, 10)) +
ggplot2::scale_y_continuous(expand = c(0, 0, 0, 0), limits = c(0, 10)) +
ggplot2::theme_minimal()
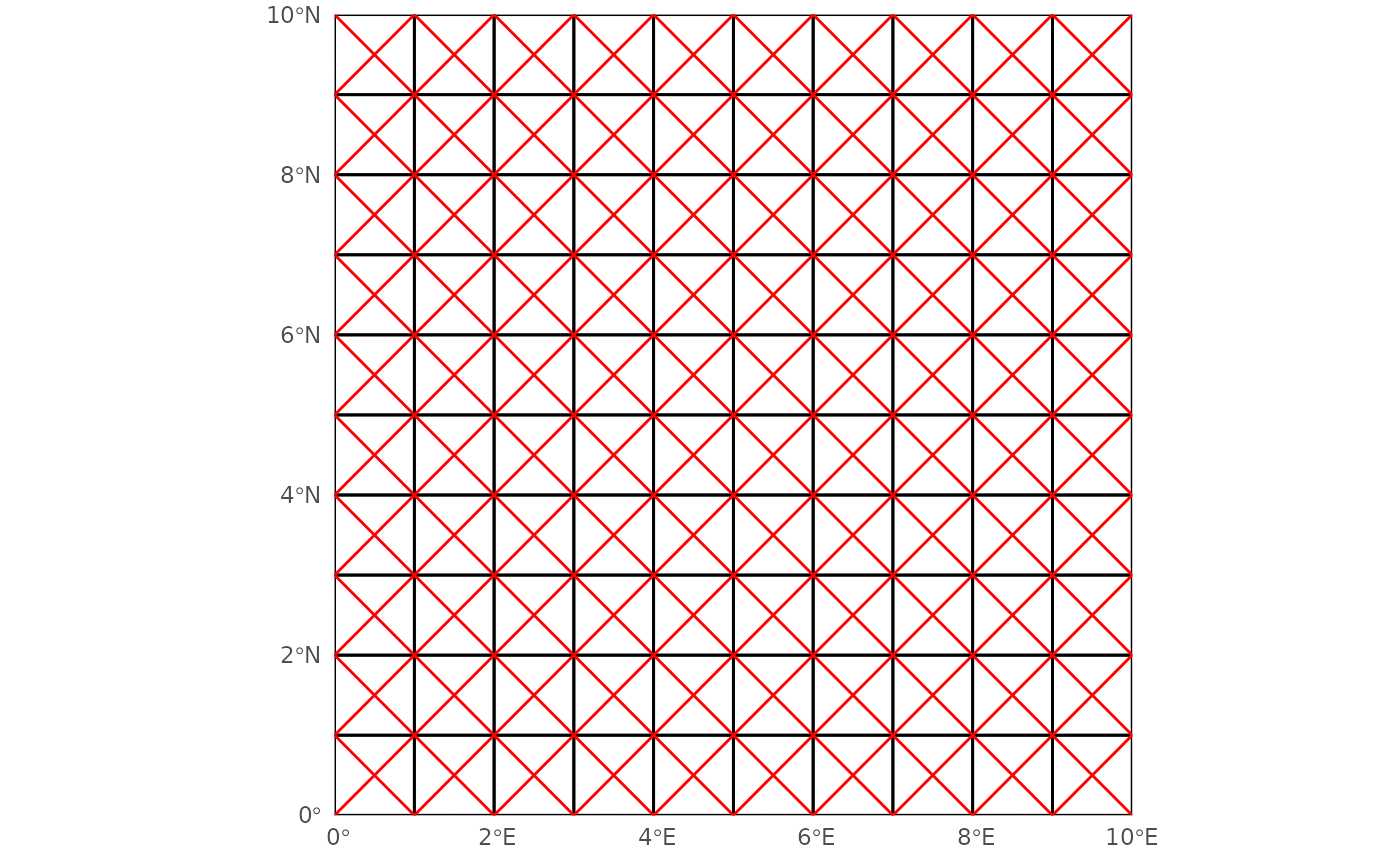
 Grid_X <- GridDiagOff(DT = Grid)
ggplot2::ggplot() +
ggplot2::geom_sf(Grid, mapping = ggplot2::aes(), color = "black",
linewidth = 0.5, fill = "transparent") +
ggplot2::geom_sf(Grid_X, mapping = ggplot2::aes(), color = "red",
linewidth = 0.5, inherit.aes = TRUE) +
ggplot2::scale_x_continuous(expand = c(0, 0, 0, 0), limits = c(0, 10)) +
ggplot2::scale_y_continuous(expand = c(0, 0, 0, 0), limits = c(0, 10)) +
ggplot2::theme_minimal()
Grid_X <- GridDiagOff(DT = Grid)
ggplot2::ggplot() +
ggplot2::geom_sf(Grid, mapping = ggplot2::aes(), color = "black",
linewidth = 0.5, fill = "transparent") +
ggplot2::geom_sf(Grid_X, mapping = ggplot2::aes(), color = "red",
linewidth = 0.5, inherit.aes = TRUE) +
ggplot2::scale_x_continuous(expand = c(0, 0, 0, 0), limits = c(0, 10)) +
ggplot2::scale_y_continuous(expand = c(0, 0, 0, 0), limits = c(0, 10)) +
ggplot2::theme_minimal()