This function generates a function that calculates integer axis values for ggplot, ensuring that the axis breaks are integers. It is particularly useful for creating cleaner, more readable plots.
Arguments
- n_breaks
integer (default: 5), the desired number of breaks on the axis. Note that the actual number of breaks may slightly differ from what is requested.
- ...
additional arguments passed on to base::pretty.
Value
A function that takes a numeric vector x and returns a vector of
integer breaks for the axis, with the names attribute set to the break
labels.
Details
The source of the function is available on this link.
Examples
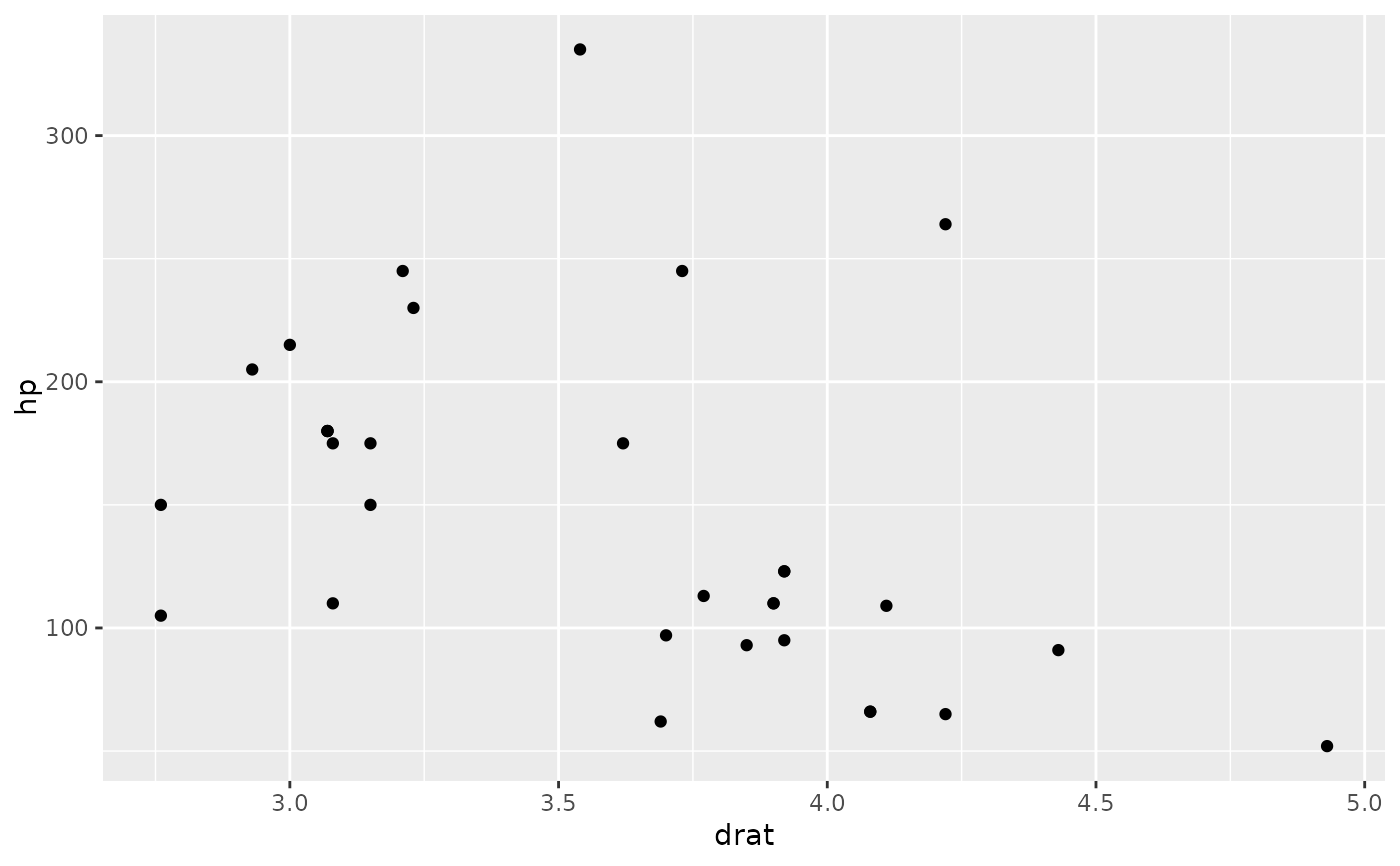
ggplot2::ggplot(mtcars, ggplot2::aes(x = drat, y = hp)) +
ggplot2::geom_point() +
ggplot2::scale_x_continuous()
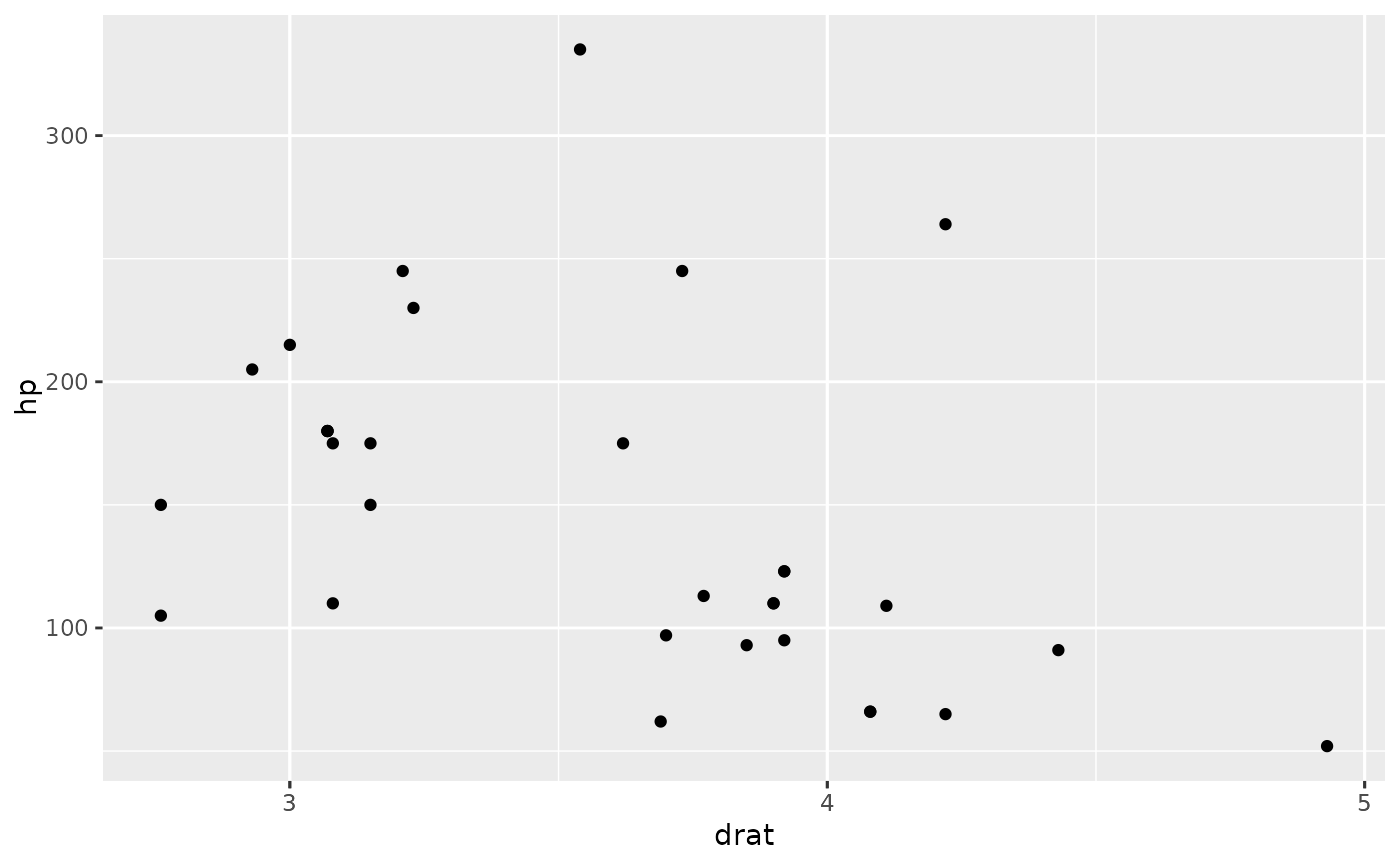
 ggplot2::ggplot(mtcars, ggplot2::aes(x = drat, y = hp)) +
ggplot2::geom_point() +
ggplot2::scale_x_continuous(breaks = integer_breaks(5))
ggplot2::ggplot(mtcars, ggplot2::aes(x = drat, y = hp)) +
ggplot2::geom_point() +
ggplot2::scale_x_continuous(breaks = integer_breaks(5))